Software to Streamline
Mapping
Mapping data and visualizing your impact is challenging, especially when you rely on manual or outdated methods. Luckily, there’s a better way.


Let us show you how Kadince can benefit your institution.

Thank you for your interest in Kadince! Your custom proposal will be emailed to you within four Kadince business hours.

Please ensure that your info is correct before submitting this form.
Thank you for your interest in Kadince!

May 4-7, | Salt Lake City, UT

Please ensure that your info is correct before submitting this form.
Please ensure that your info is correct before submitting this form.

Please ensure that your info is correct before submitting this form.

Please ensure that your info is correct before submitting this form.

Please ensure that your info is correct before submitting this form.
Please ensure that your info is correct before submitting this form.
Mapping data and visualizing your impact is challenging, especially when you rely on manual or outdated methods. Luckily, there’s a better way.
Build dynamic, interactive maps in seconds.
Overlay census tract boundaries and demographic insights.
Customize map views to highlight the data that matters most.

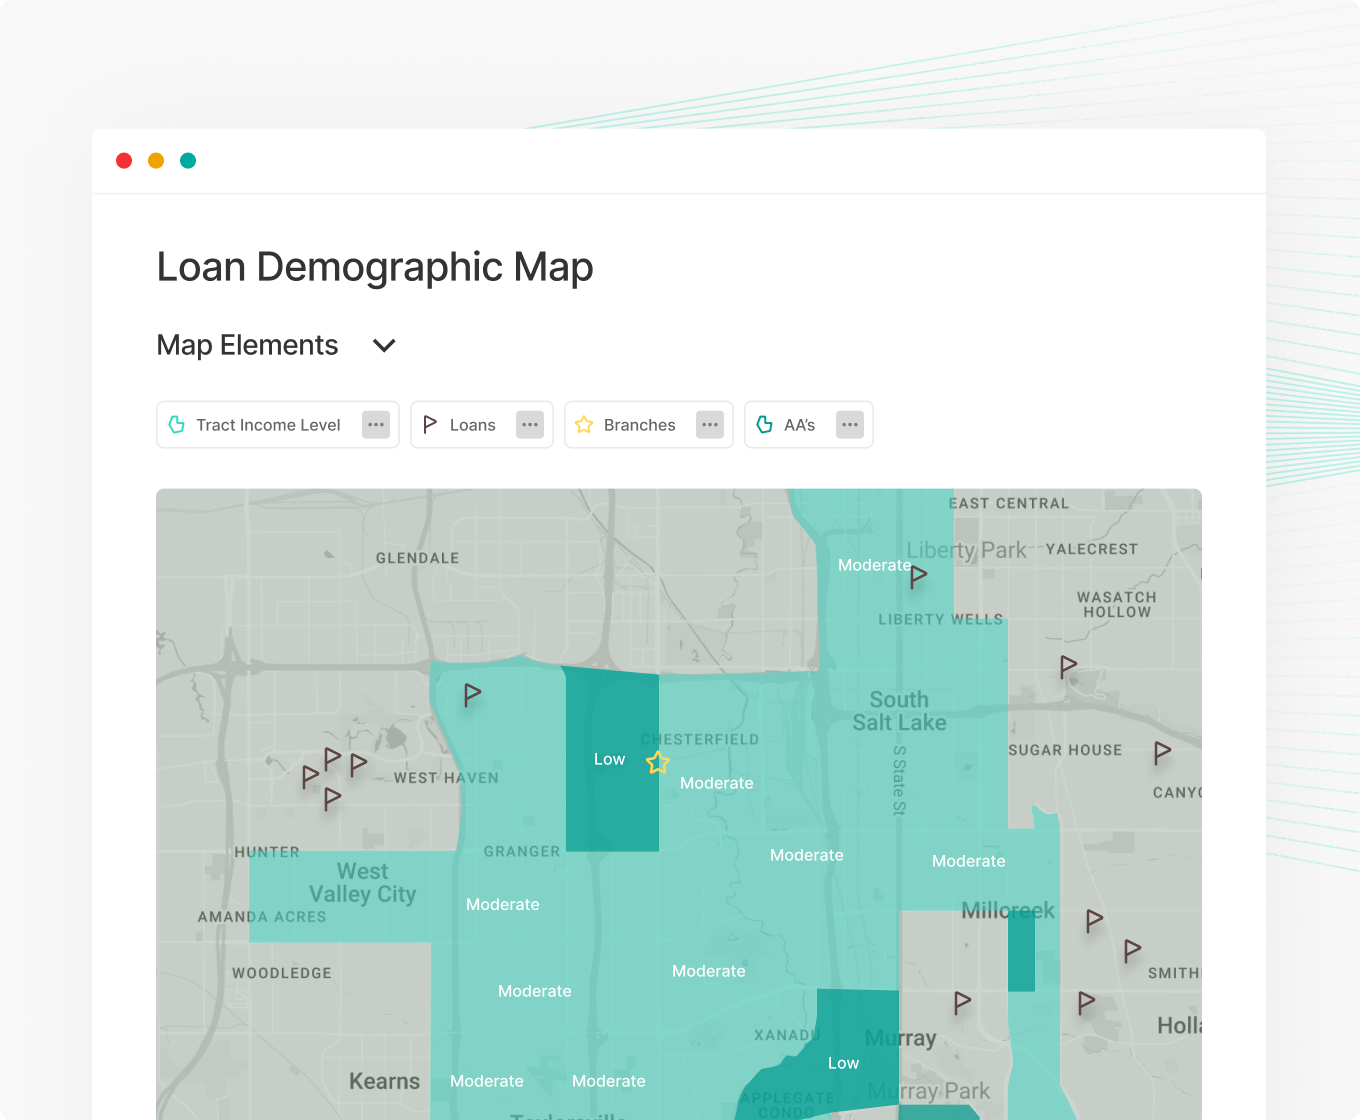
Refine map views with powerful, multi-layer elements.
Segment data by income levels, loan purpose, products, or geography.
Compare different regions or borrower groups instantly.
Identify lending patterns and service gaps at a glance.
See areas where lending patterns may indicate fair lending concerns.
Reveal trends that support strategic and compliance decisions.


Download maps as print-ready images or PDFs.
Export complete maps (with legend) in one click.
Use exported data to create audits and exam reports.
Everything you need to succeed, so you can focus on what matters most.


Choosing new software is a big decision, but Kadince makes it simple. Intuitive, user-friendly, and built to streamline your processes, Kadince is the smart choice for your institution.